VCE Chemistry Unit 3 (Dot points from the Study Design 2023- 2027)
- the dynamic nature of homogenous equilibria involving aqueous solutions or gases, and their representation by balanced chemical or thermochemical equations (including states) and by concentration-time graphs
- the change in position of equilibrium that can occur when changes in temperature or species or volume (concentration or pressure) are applied to a system at equilibrium, and the representation of these changes using concentration-time graphs
- the application of Le Chatelier’s principle to identify factors that favour the yield of a chemical reaction
- calculations involving equilibrium expressions (including units) for a closed homogeneous equilibrium system and the dependence of the equilibrium constant (K) value on the system temperature and the equation used to represent the reaction
- the reaction quotient (Q) as a quantitative measure of the extent of a chemical reaction: that is, the relative amounts of products and reactants present during a reaction at a given point in time
Le Chatelier’s principle
If a system at equilibrium is subjected to a change, then the system will adjust to partially oppose the EFFECT of the change.
Key changes can be made to an equilibrium system are listed below.
Change 1: Temperature (increase/decrease)
If the change made is increasing the temperature, then the effect of this change on the equilibrium system is increase in (added) heat energy. Vice versa for decreasing the temperature.
The system would adjust this change, depending on what type of reaction it is: whether exothermic or endothermic reaction.
Exothermic reactions at equilibrium:
When the temperature is increased, the exothermic system will adjust by shifting the equilibrium towards the backward reaction. Hence, the system would consume the added (extra) energy, reducing the amount of heat energy.
When this event is represented by a graph, ALL the elements in the graph shows GRADUAL changes: gradual increase in reactants and gradual decrease in products are evident until the system reaches its new equilibrium.
Additionally, temperature impacts the Kc value of the system. In this case of increasing the temperature in an exothermic system Kc value will decrease the Kc value due to reduced concentrations of products.
(Kc =[Products]coefficient/[Reactants]coefficient)
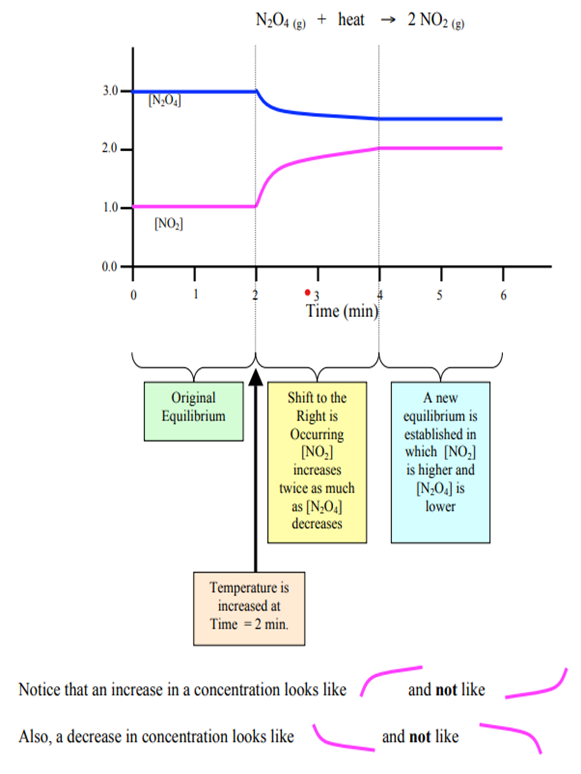
When the temperature is increased, the endothermic system will adjust by shifting the equilibrium towards the forward reaction. Hence, the system would consume the added (extra) energy, reducing the amount of heat energy.
When this event is represented by a graph, ALL the elements in the graph shows GRADUAL changes: gradual decrease in reactants and gradual increase in products are evident until the system reaches its new equilibrium.
Additionally, temperature impacts the Kc value of the system. In this case of increasing the temperature in an endothermic system, the Kc value will decrease due to increased concentrations of products.
Your task:
Summarise what will happened to the equilibrium systems (both exothermic and endothermic), when the change made is decrease in temperature?
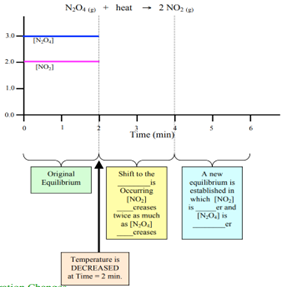
Change 2: Pressure or volume in gaseous systems
Graphic illustration will show a sudden increase in ALL reactants and products.
- Change – Volume decrease à effect of change- Pressure increase
How to partially oppose this effect? By shifting the position of equilibrium towards a smaller number of particles.
Graph – All elements in the graph have same upward spike (same spike height) initially when the change is made.
Example:
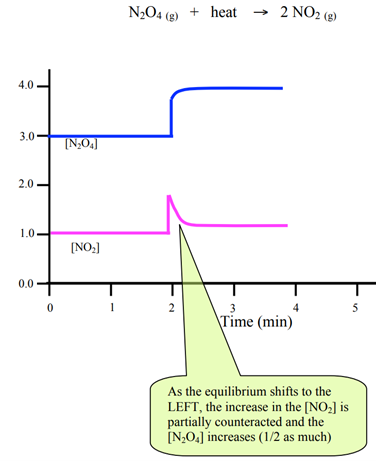
- Change – Volume increase à effect of change- Pressure decrease
How to partially oppose this effect? By shifting the position of equilibrium towards a greater number of particles.
Graph – All elements in the graph have same downward spike (same spike height).
Change 3: Concentration (or amount of water/dilution)
Dilution Sudden decrease in all reactants and products
- Change – add water à effect of change- decrease in concentration
How to partially oppose this effect? By shifting the position of equilibrium towards a greater number of particles.
Graph – All elements in the graph have same downward spike (same spike height).
- Change – evaporate water à effect of change- increase in concentration
How to partially oppose this effect? By shifting the position of equilibrium towards a smaller number of particles.
Graph – All elements in the graph have same upward spike (same spike height).
Change 4. Adding or removing reactants
- Adding reactants:
Graph: Upward spike ONLY on added reactant
- Removing reactants:
Graph: downward spike ONLY on removed reactant
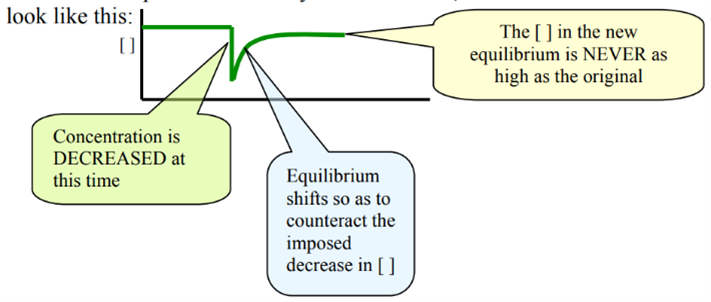
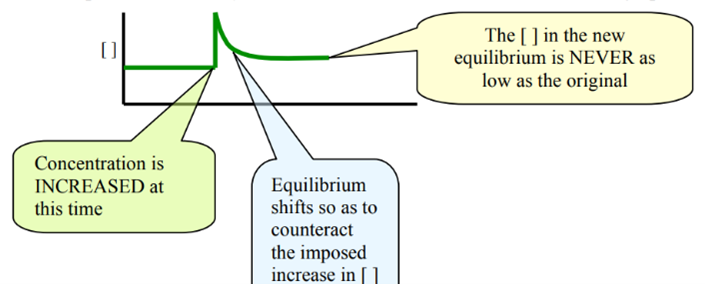
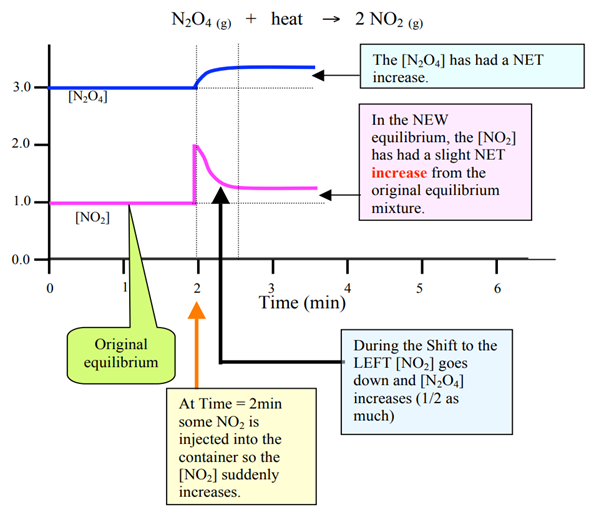
One sudden increase (added reactant) or one sudden drop (removed reactant)
Example:
Change 5 – Adding or removing products
Adding product
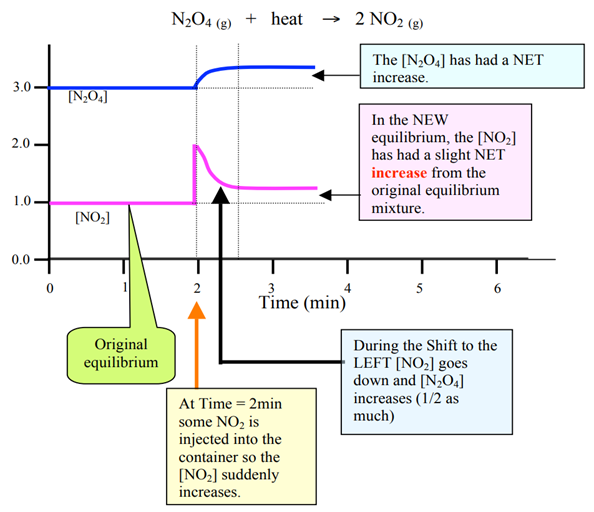
Graph: Upward spike ONLY on added product
Removing products
Graph: downward spike ONLY on removed product
One sudden increase (added product) or one sudden drop (removed product)

Leave a Reply